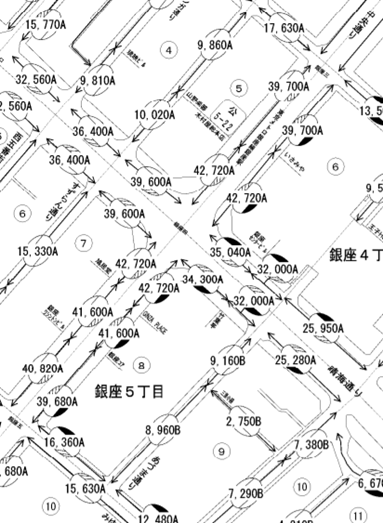
Japan’s tax agency has released the roadside land prices (“Rosenka”) on July 1, 2021. The average roadside land prices fell for the first time since 2015. The decline of the roadside land price was already expected when the land ministry revealed the result of the land price survey (“Koji Kakaku”), about 26,000 locations nationwide, on March 23 this year. The roadside land prices are shown on maps, as an example below, with prices shown in thousands of yen per square meter. The most expensive roadside land price, 42.7 million yen per square meter, down 7.0% from previous year, was located on Ginza Chuo-dori near the intersection with Harumi-dori where stores such as Mitsukoshi and Mikimoto are placed.

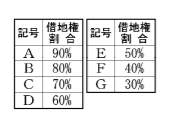
The alphabet attached to the roadside land price indicates the ratio of the leasehold value to the total value of the land. If an “A” is attached to the roadside land price, the value of the leasehold is 90% of the land value. For the meanings of the other letters of the alphabet, please see the table below.

Maps of roadside land prices can be found at the following link: https://www.rosenka.nta.go.jp/main_r03/index.htm
The roadside land price is used to calculate the inheritance tax and does not necessarily represent the market value of the land. First, the roadside land price is set at about 80% of the “fair values” of lands surveyed by the land ministry at the beginning of each year. Second, the market value may deviate from the fair value. Third, the roadside land prices do not reflect the land-specific price factors like shape, direction, etc. In addition, when calculating the value of leasehold, various contractual clauses must be taken into account. The ratio shown on the roadside land price map may be differ significantly from the actual ratio.
Despite some caveats, like above, roadside land prices are useful in assessing land values.
Hajime Nakata, Jiro Masuda (Nakata & Partners Law Office)
